


A digital salinity management tool...
...that helps protect drinking water safety, sustainable freshwater use, and infrastructure integrity in coastal regions experiencing climate change.
ROLE
Product Design Lead
TIMELINE
Jun '24 - Feb '25
TEAM
PM, 4 Scientists, 2 Developers
CHALLENGE
A need for accurate predictions of saltwater intrusion

THE PRODUCT
Forecasting salt levels for water security
“Huge language barrier between the scientist and stakeholders. Stakeholders want a definitive predictive output, but want the freedom to manipulate the input”
-- Environmental Protection Agency
IMPACT
From validation to momentum
Follow-on funding from the NSF.
Stakeholders expressed intent to purchase.
Letters for collaboration from EPA and USGS.
GROUNDBREAKING TECHNOLOGY
Pairing artificial intelligence algorithms with watershed and estuary models.
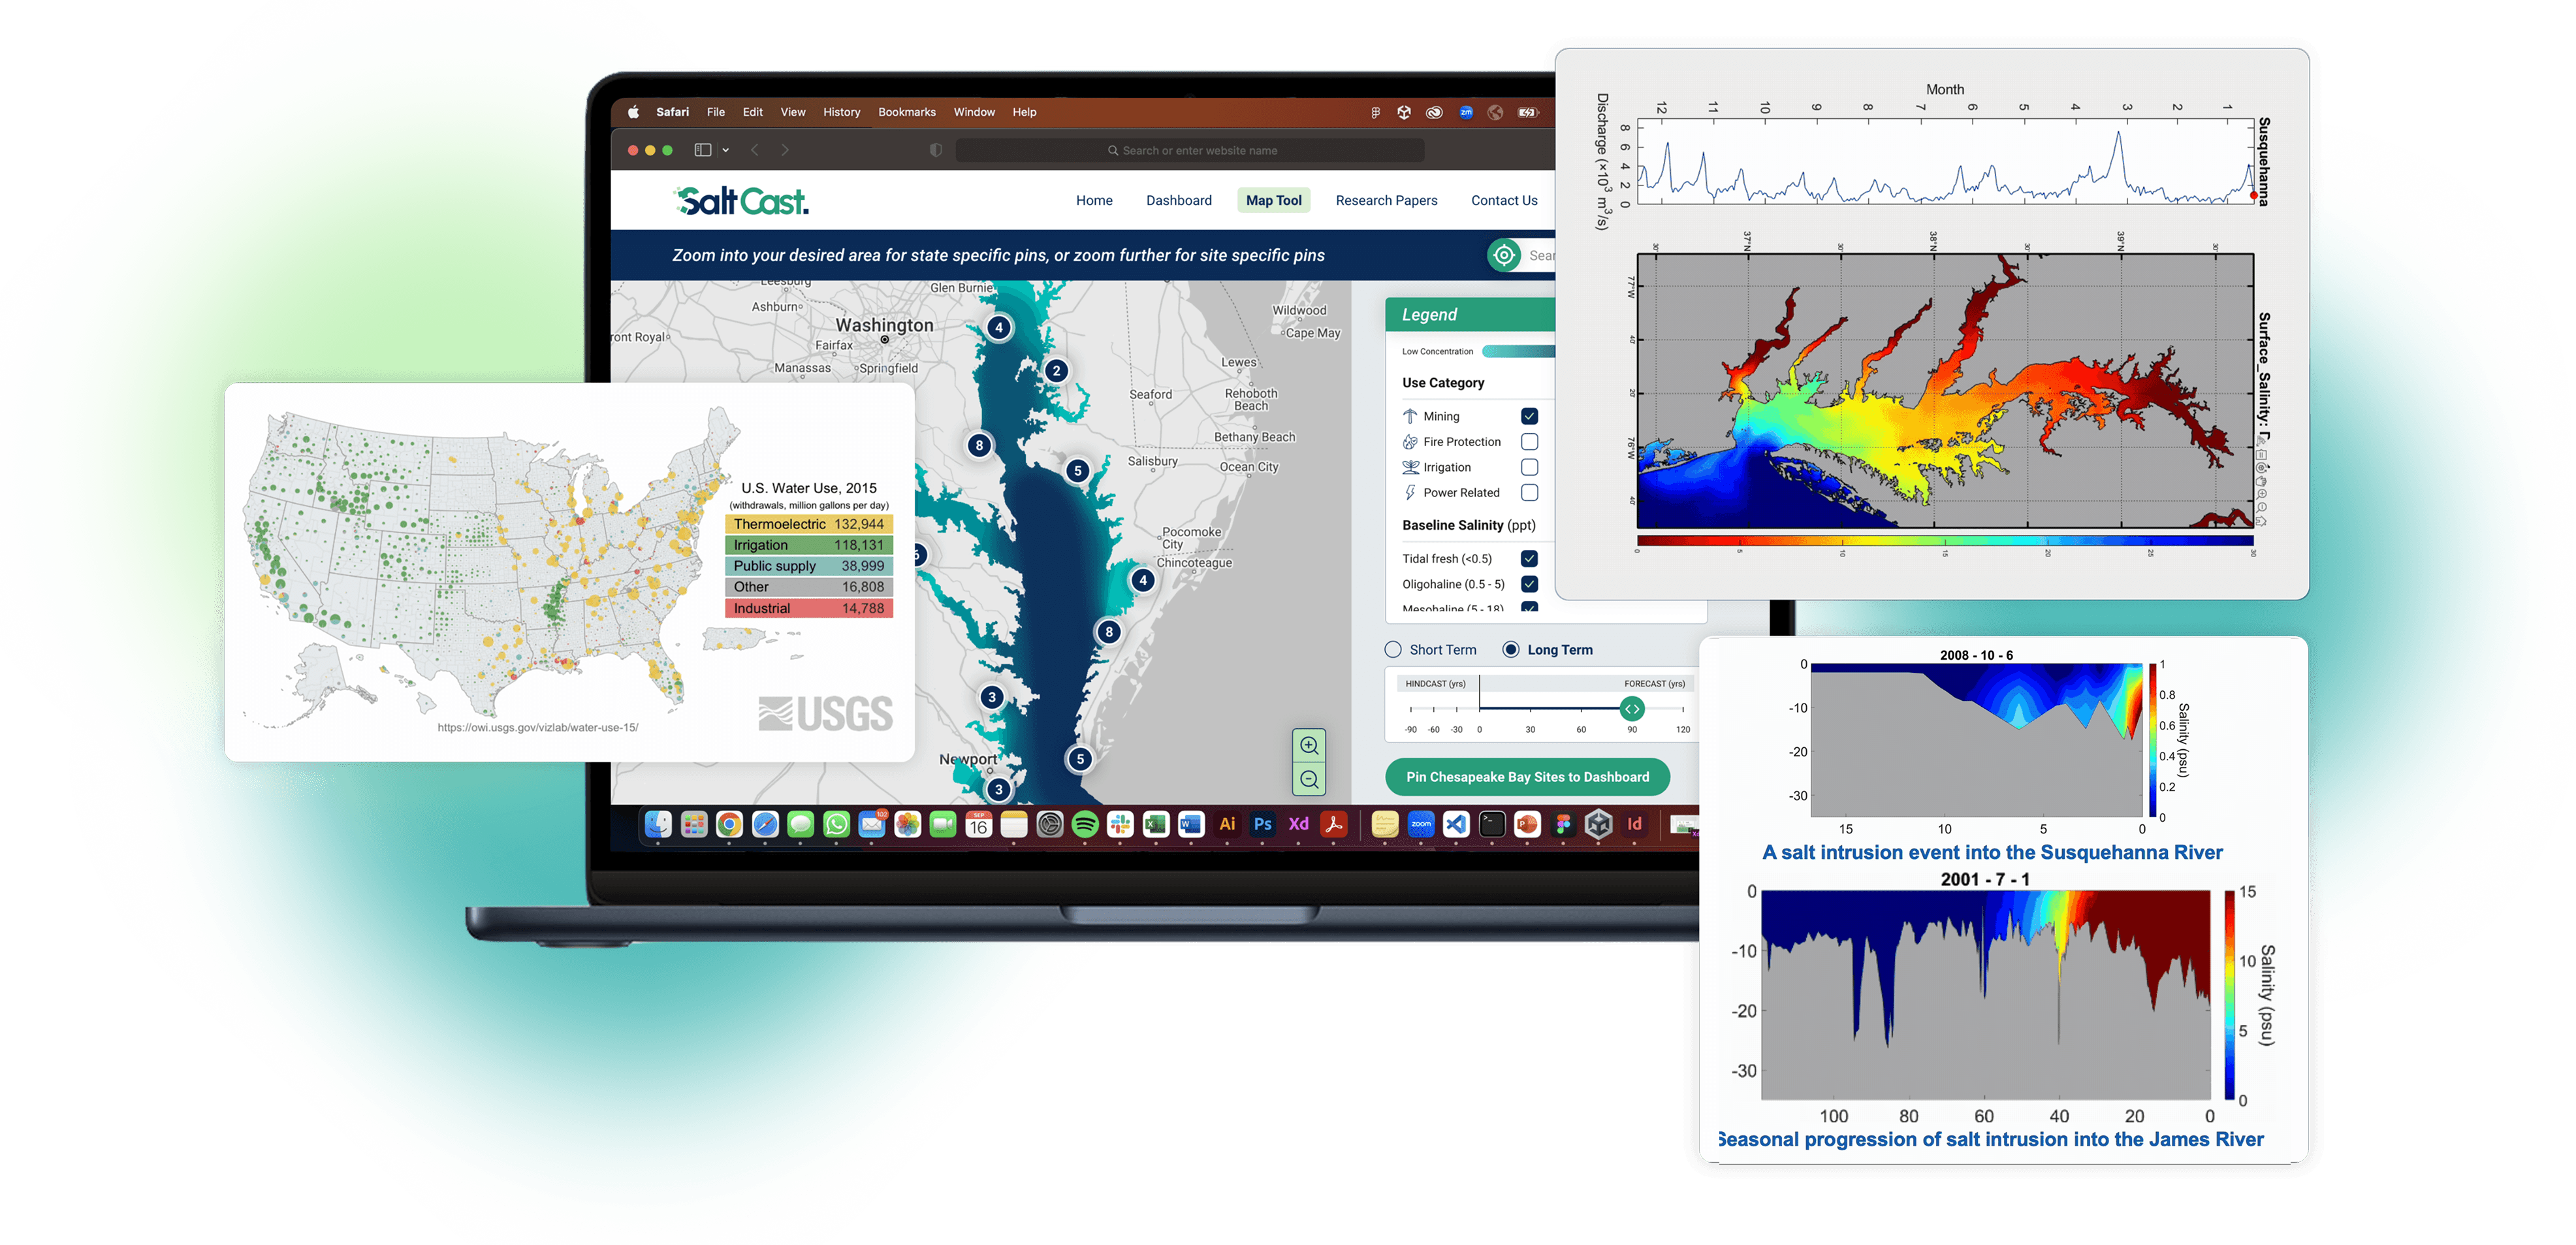
SaltCast delivers ion-specific salinity and corrosion forecasts that turn complex climate data into actionable insights. Unlike existing tools, it incorporates salinity, supports scalable user inputs, provides corrosion exposure data, and forecasts from 2 months to 100 years.
Using hydrologic data from across the country and AI-driven predictive models, SaltCast forecasts future conditions and continuously validates its predictions against real-world water samples.


A seamless, user friendly experience

Backed by real data and climate models


USERS
Understanding our portfolio of users
Interviews with potential beneficiaries.
Of interviewees expressed interest.
User-testing interviews and 1 focus group.
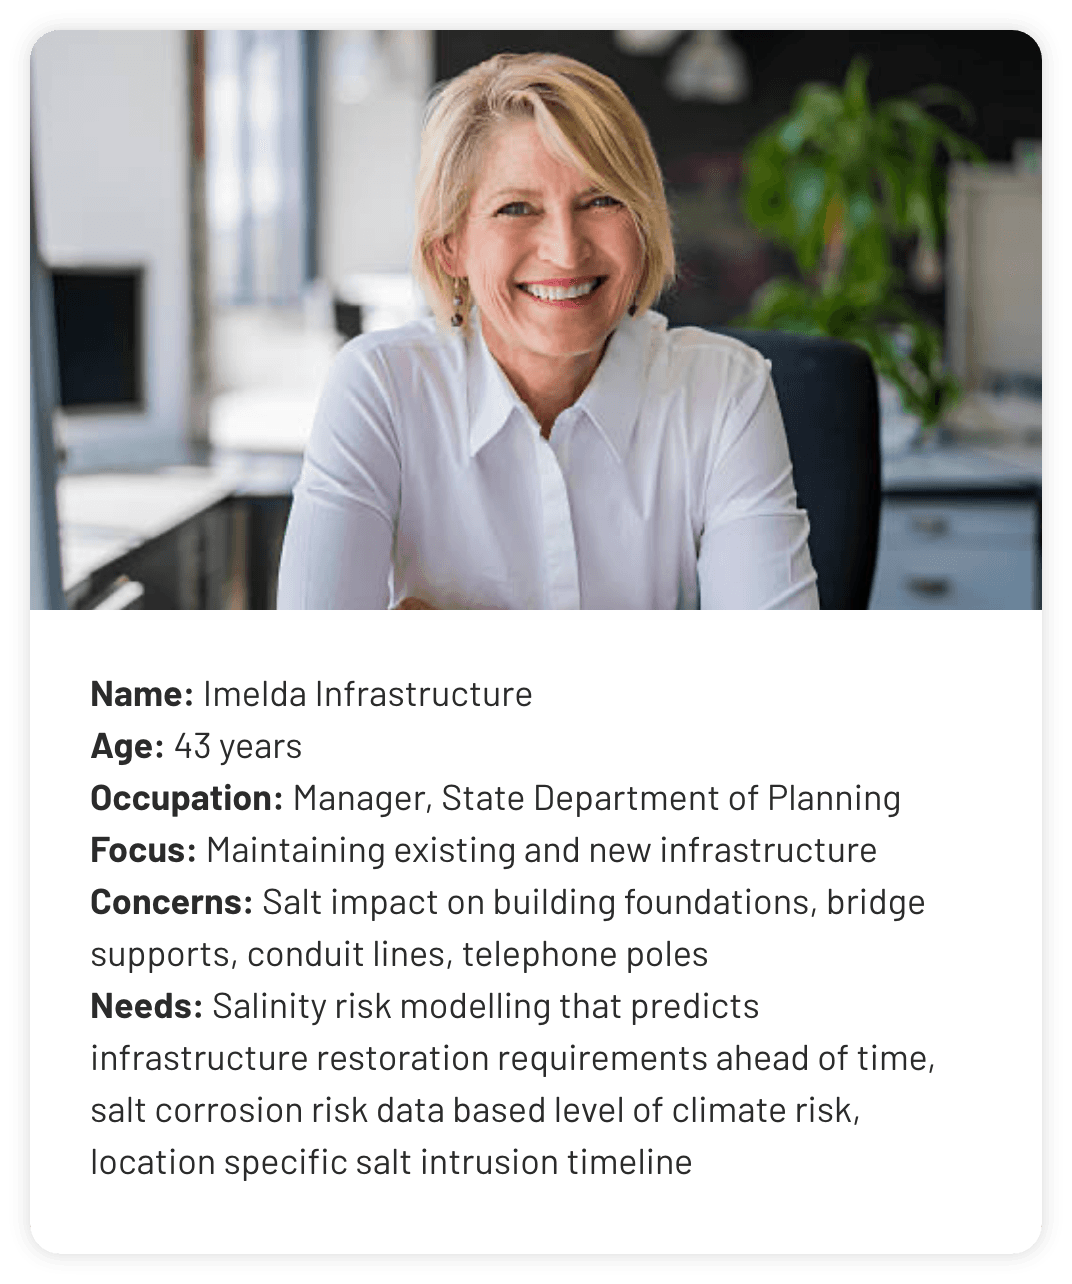
SaltCast targets coastal freshwater users and infrastructure planners.

Water suppliers who must monitor salt in their source water

State and regional agencies who permit water and land uses

Federal agencies tasked with adapting to climate change
“The science is not there, we have not as a society linked water quality with use and withdrawals.”
-- State Department of Planning

ACCESSIBILITY
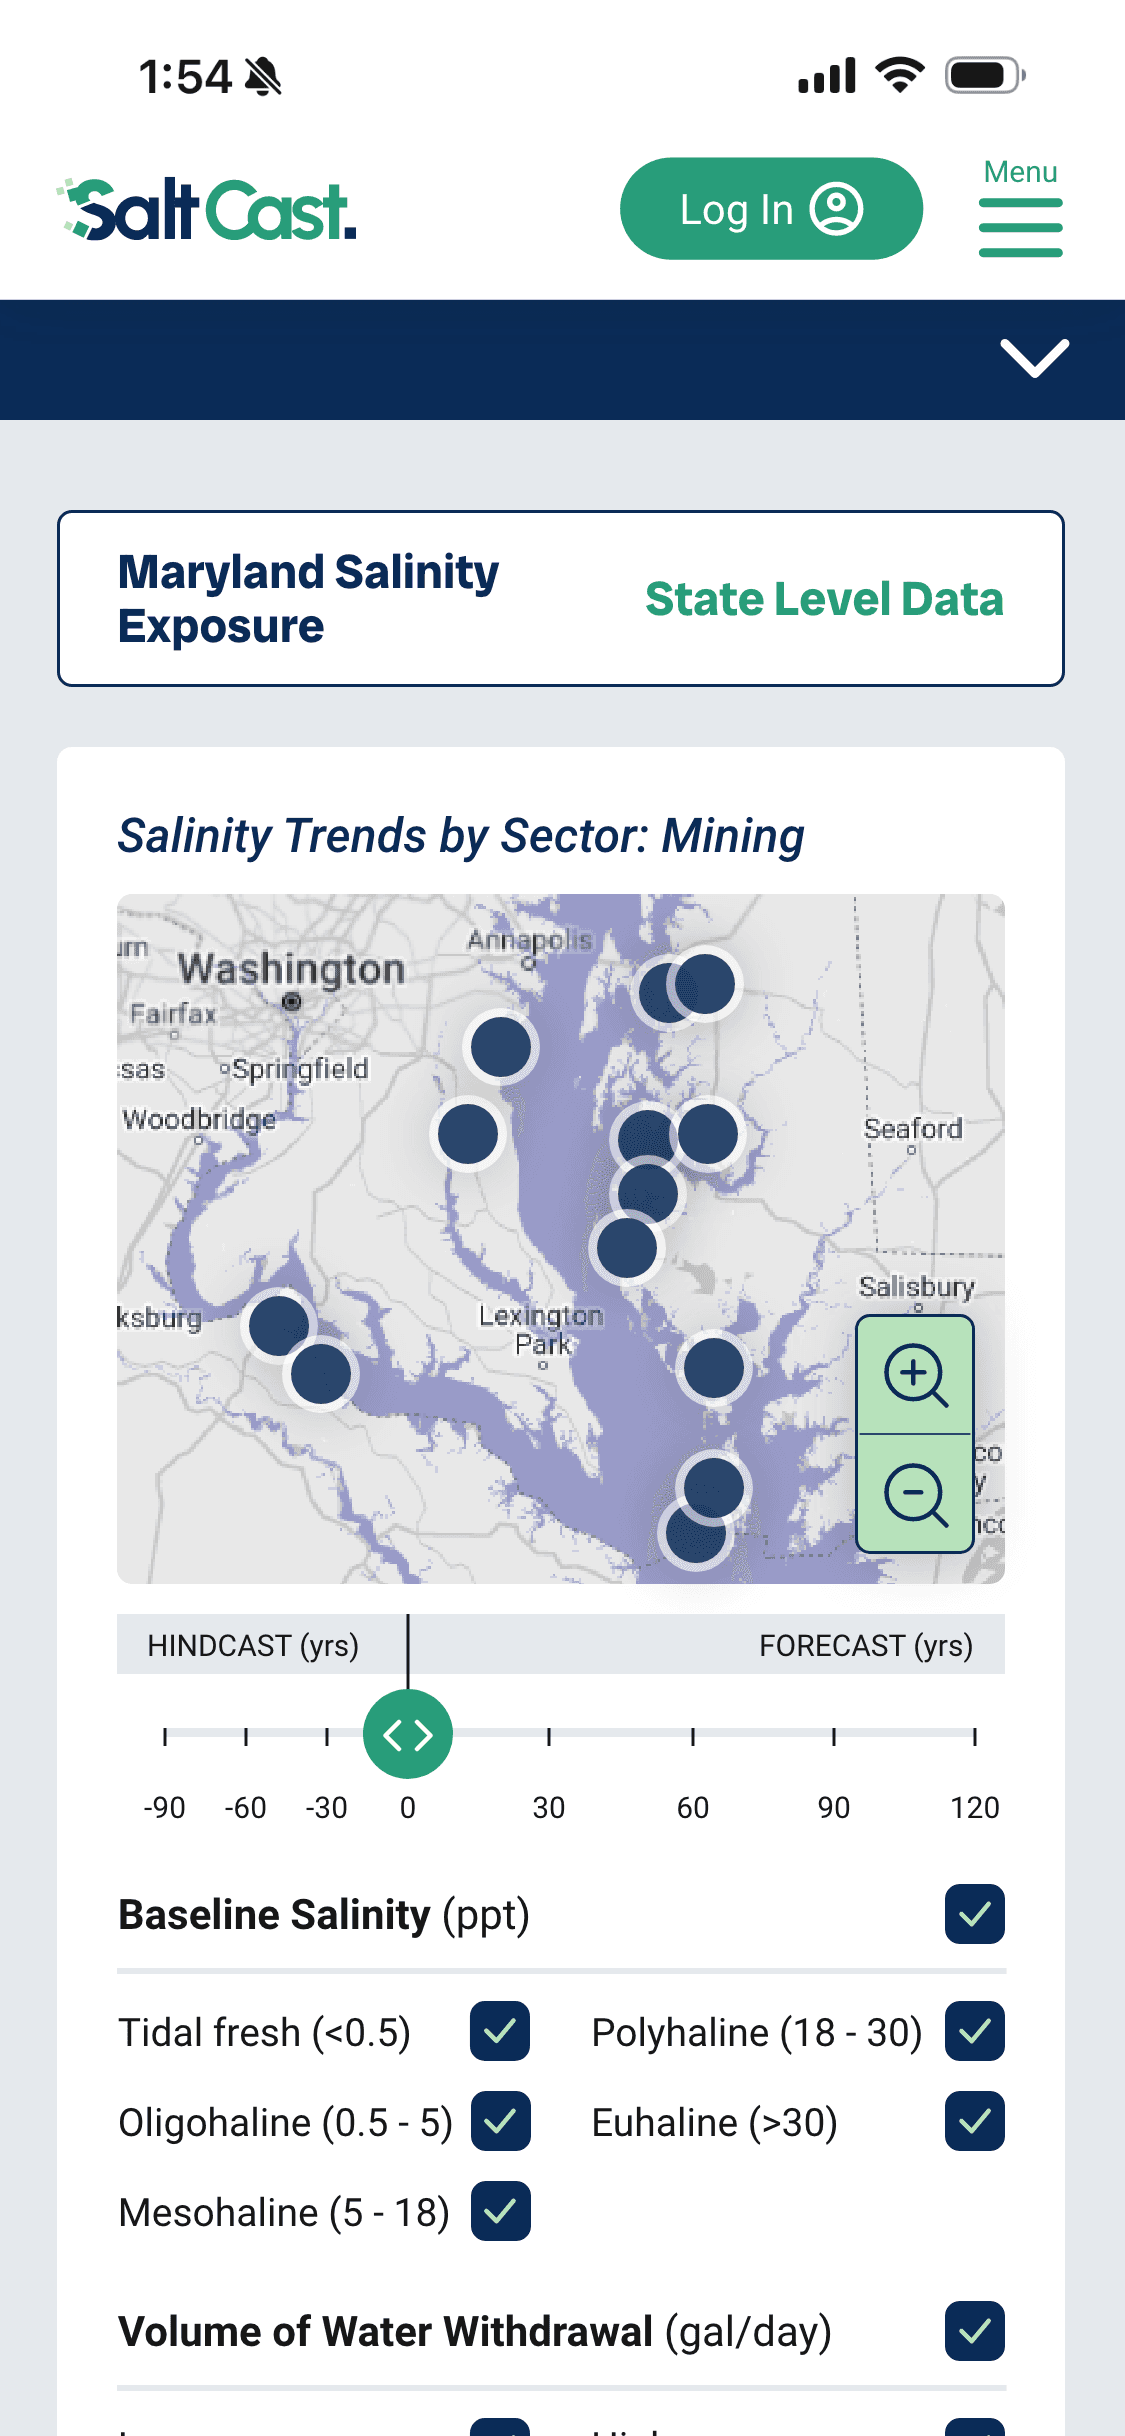
Responsive and accessible design
Many users preferred to work from a phone or tablet, citing convenience or visibility constraints. Therefore, the web tool was designed to work across devices including phones, tablet and desktops. We developed 5 breakpoints to ensure a seamless user experience.
We followed WCAG compliance to a AA standard to ensure accessibility across users.
“I mostly use my iPad because I have trouble reading small text... at work, I get information on my phone.”
-- Water Supplier


Branding
“Industry wants a clean GUI that is really simple. A good model with a clean interface would be useful.”
-- Water Supplier

NOTIFICATIONS
Alerts and nudges
Our users requested that the web tool not only deliver data on demand, but also alert the user when certain user specified thresholds have been exceeded. We are in the process of developing the app version of the tool to allow for notification delivery.
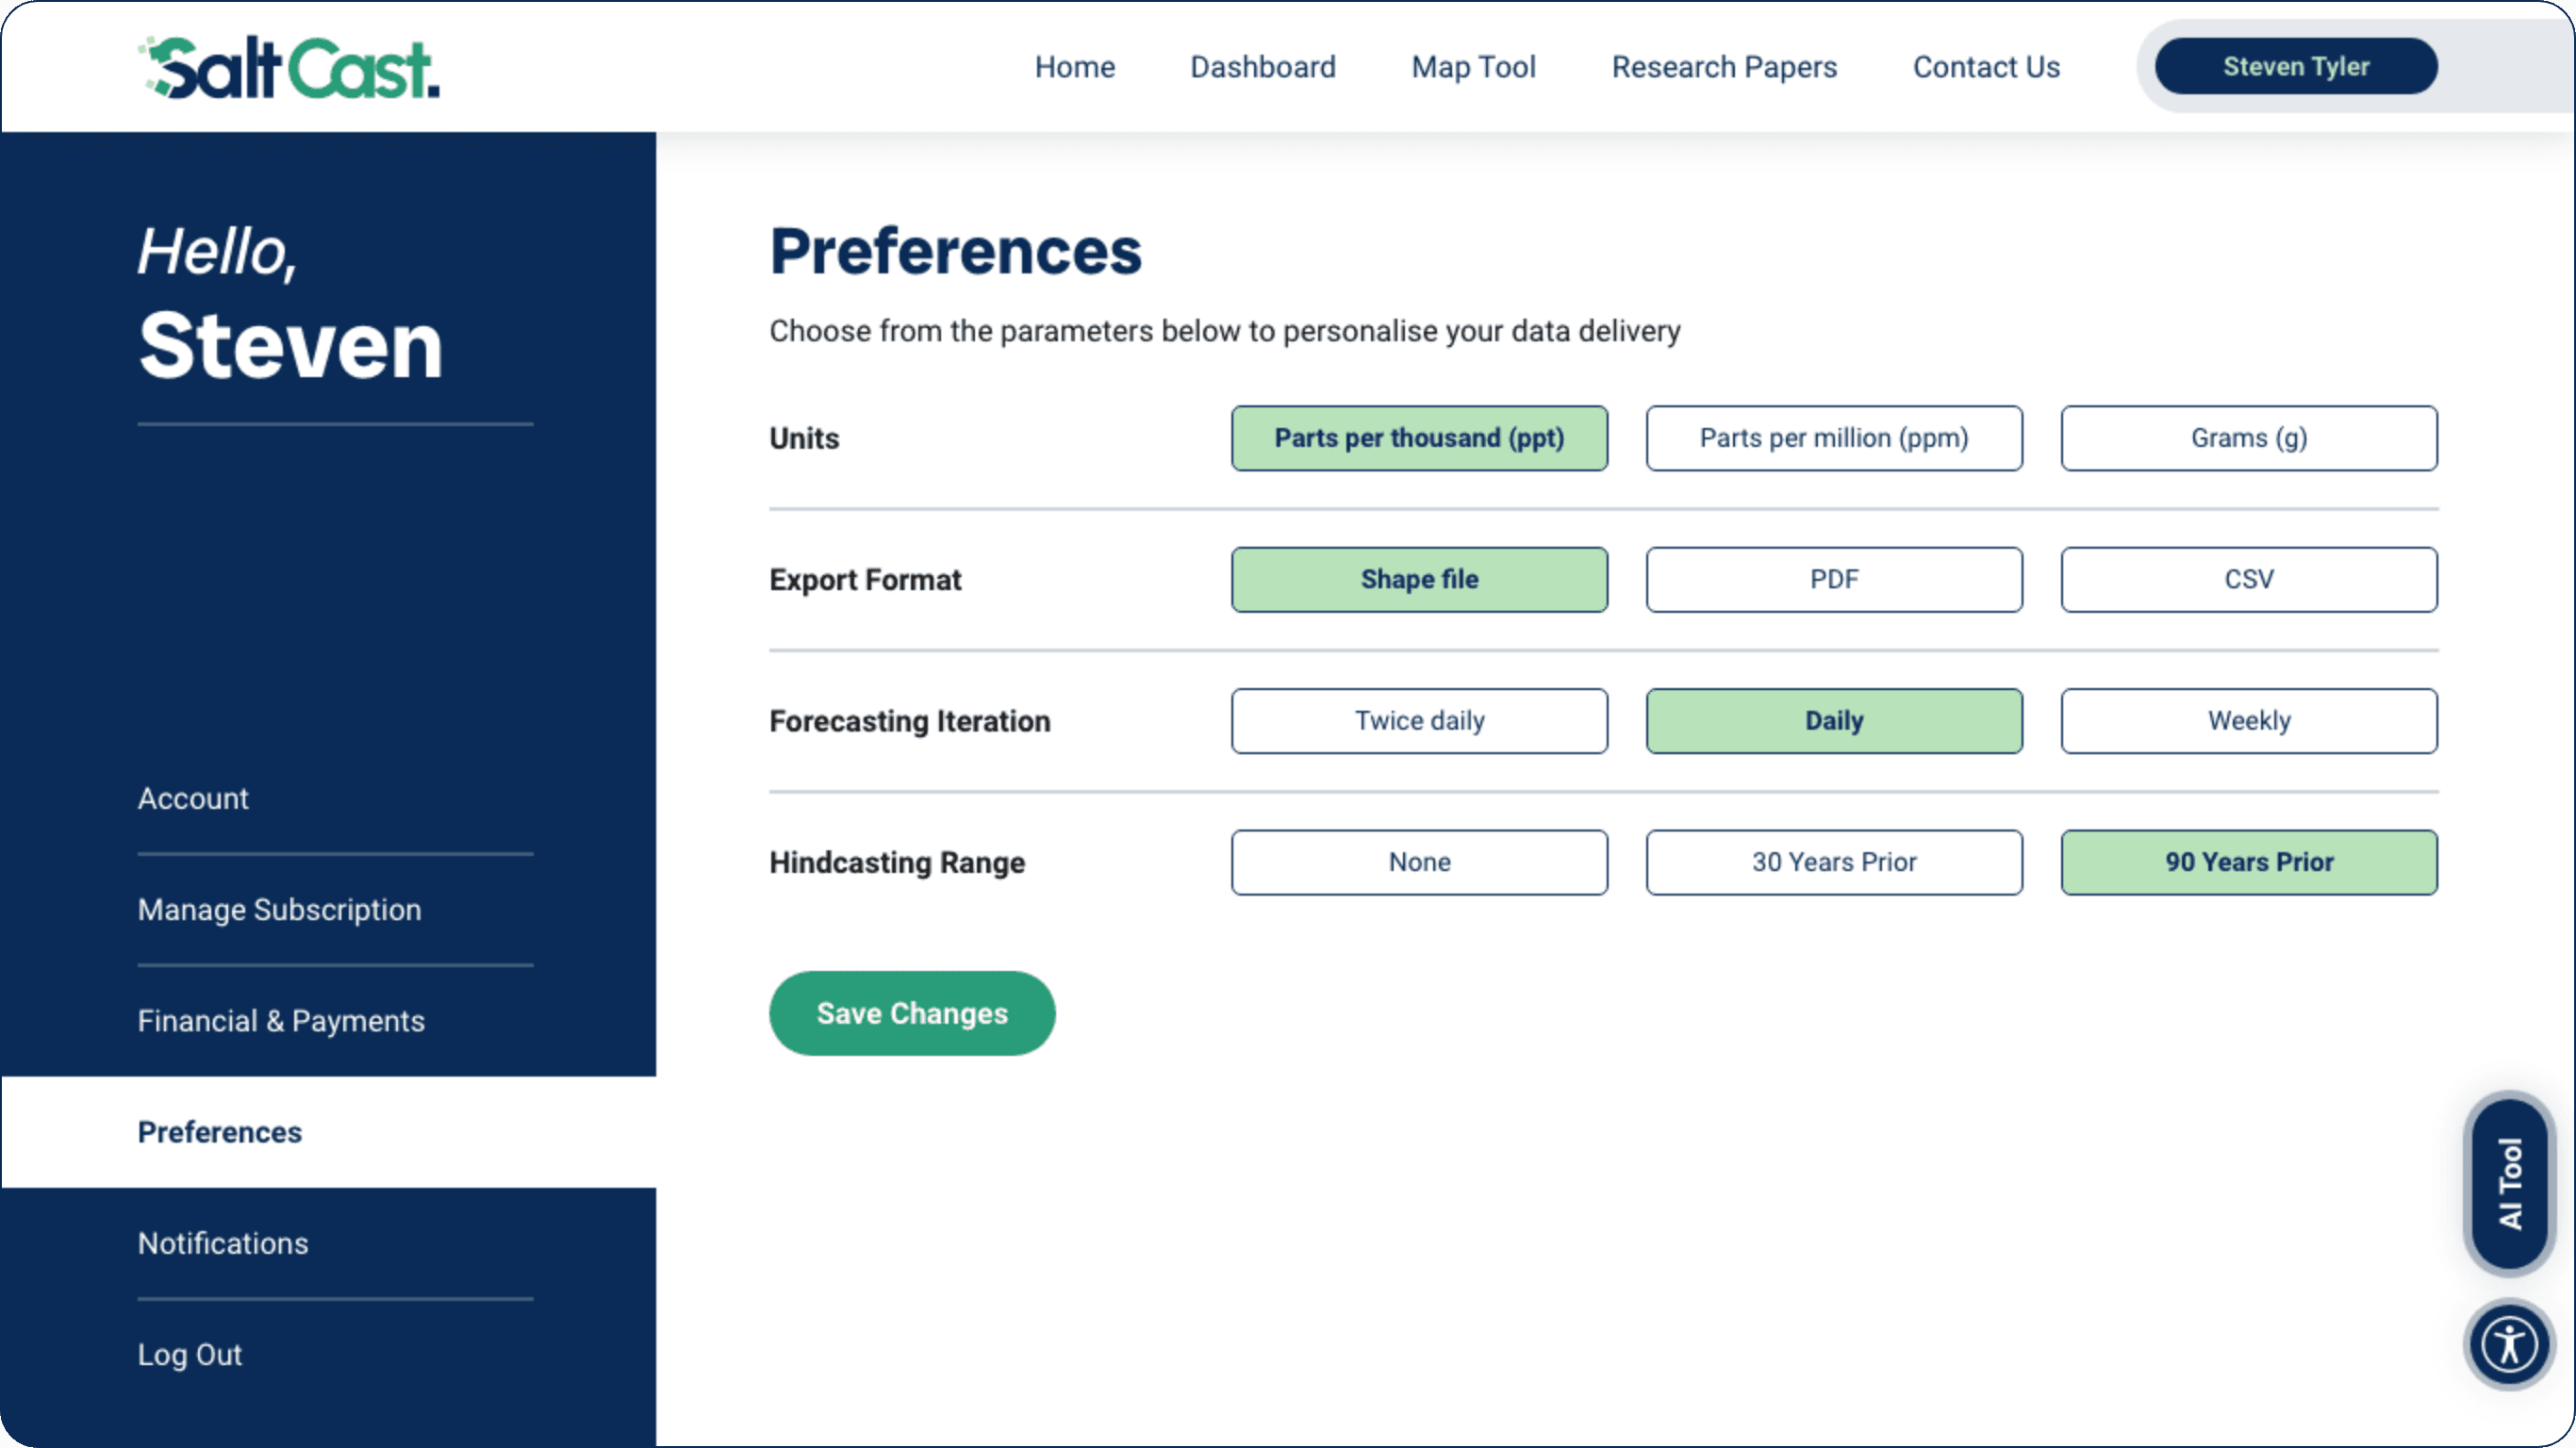
ACCOUNT CUSTOMIZATION

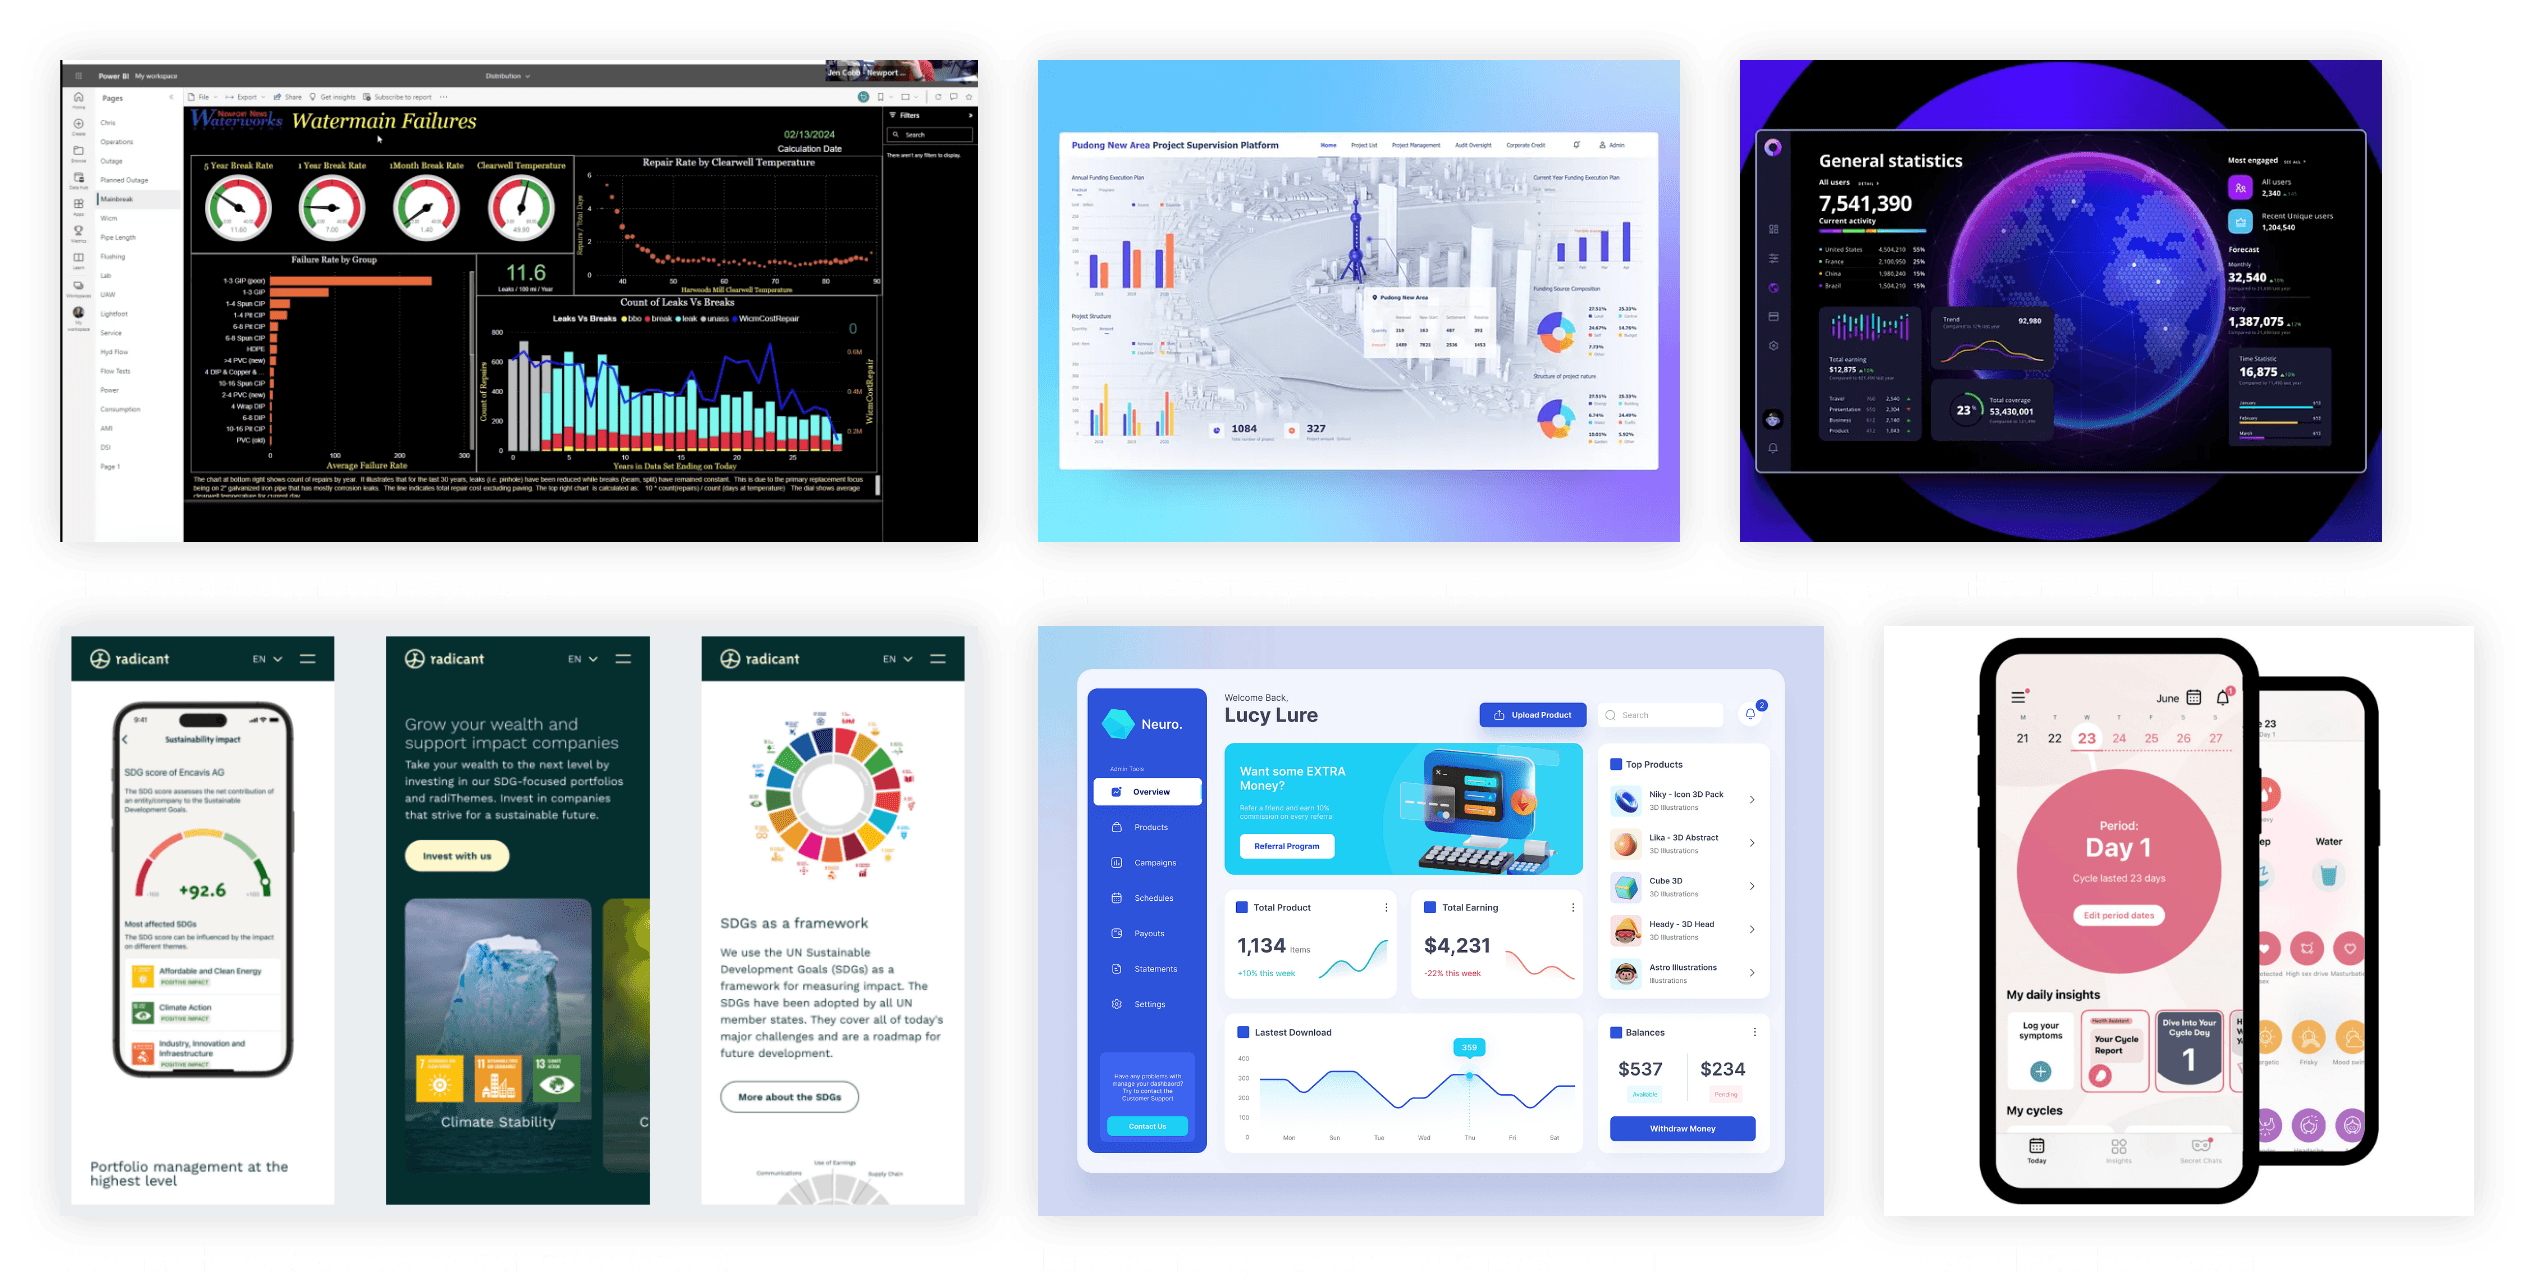
COMPETITIVE ANALYSIS
Analyzing the competition


PROCESS
The journey to SaltCast

User research
The team interviewed 21 stakeholders and potential users to develop an understanding of their needs. 90.5% of interviewees expressed interest in the project and felt that it would aid them in daily operations. Our users revealed concerns over water quality and salinity intrusion issues and interest in a digital tool to help mitigate these risks.Users were interested in a resource that would bridge the language barriers between scientists and stakeholders, provide both long- and short-term data depending on the need, and offer definitive predictive outputs while allowing for user input manipulation. Moreover, users asked for different account types based on the complexity of need (including an API offering), corrosion exposure data, threshold markers, exact figure graphs, a user friendly and quick interface, and information on different contaminants. Users stressed that the tool should be communicated as a financial resource that will save money, and an automated product (rather than a smart product) to appeal to a wider audience.
Interview Synthesis

Persona development




Prototype development

Product development
The second round of interviews took place with 18 prospective users to provide feedback on the interactive prototype. We were asked to ensure the tool provided mid-term forecasting 1-10 years into the future as this is a currently untouched space. Additional changes included a more advanced API access offering, a custom solutions offering for higher budget users, responsive design across devices, and accessibility design to make the product widely usable. Further changes were to allow user settings to define units, user input for desired salinity range, intake depths, climate scenarios, and multi-location/area data viewing and comparison. We received additional feedback during the in-person workshop that we intend to incorporate in phase2- uncertainty ranges for any concrete figures we provide, “bad” colors to indicate when a threshold has reached a negative stage, user testimonials on the website to show new users the different available pathways, larger threshold numbers to make at-glance data information digestion easier, and a notification alert system.
